.png)
From workspaces to views: A look into Retable's structural components
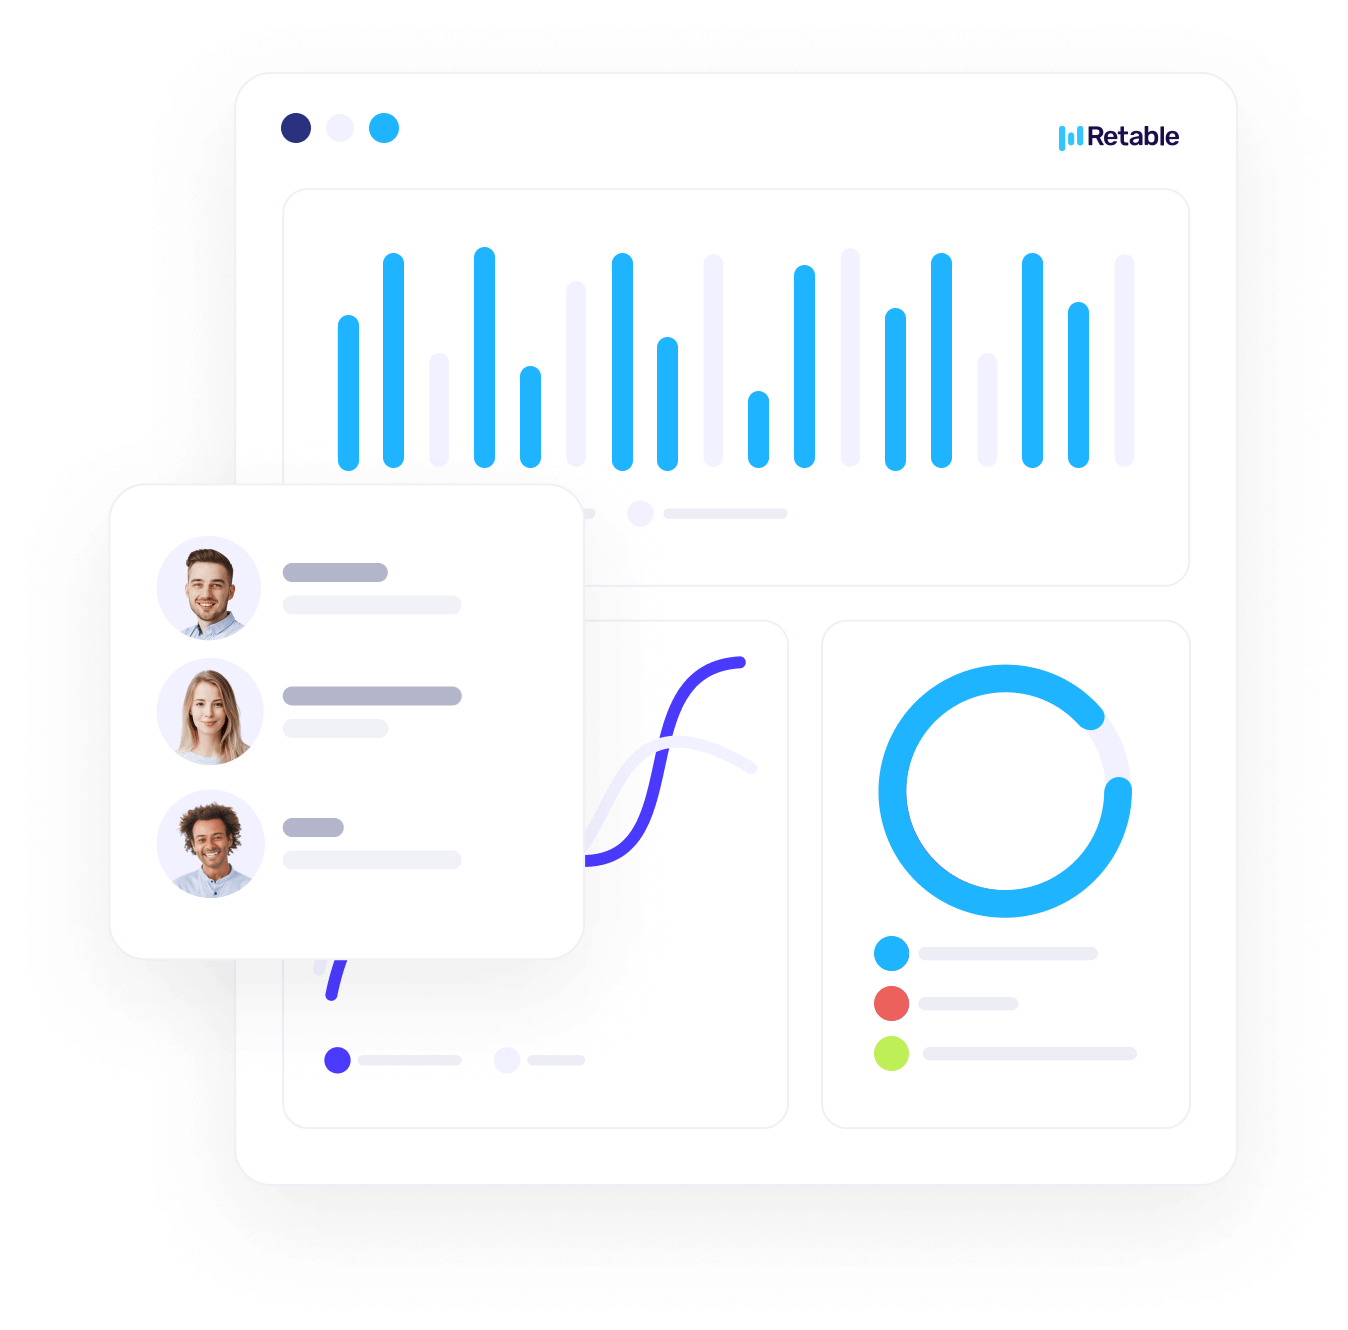
Retable is more than just a data tool; it's a comprehensive system designed for clarity and efficiency. In this exploration, we'll break down its core components, starting with the foundational workspaces and culminating in the versatile views. Whether you're a newbie or a seasoned user, gain insights into how Retable structures and organizes information, making data management a breeze.
.png)
Spreadsheets have always been a key tool for organizing data. But Retable is changing the spreadsheet game. Instead of just rows and columns, Retable offers more with its special workspaces and views. If you've used a spreadsheet before and want to see what makes Retable different, or if you're just curious about this new kind of spreadsheet, this guide will help you understand its unique features.
Table of contents
What is Retable?
Retable, at its core, is a modern spreadsheet tool designed to empower users to organize, analyze, and visualize their data more intuitively. But to label it as just another spreadsheet software would be an understatement. Retable combines the best of traditional spreadsheets with the flexibility of a database, allowing users to create everything from simple lists to complex workflows.
Retable's structure 101
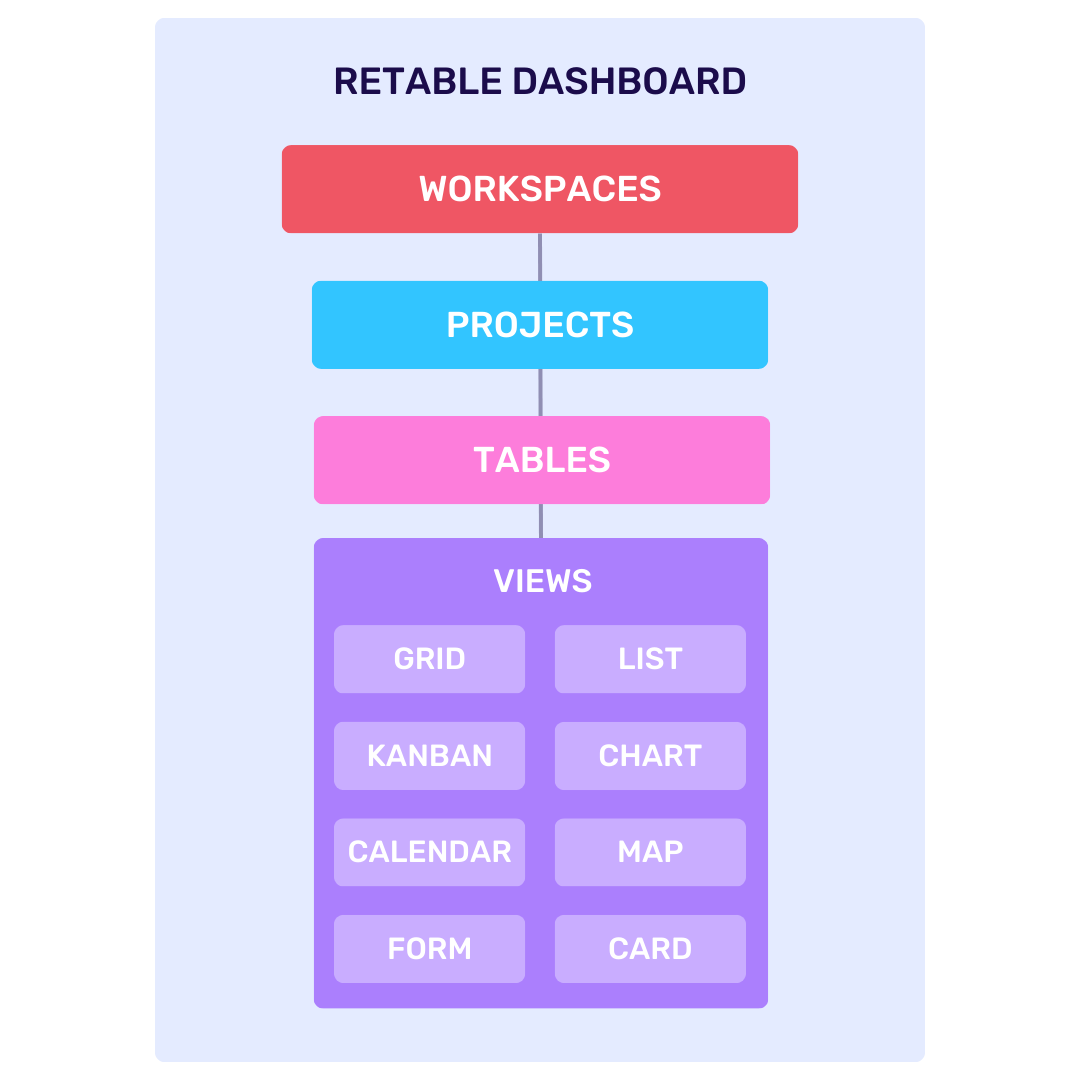
Dashboard
Retable Dashboard serves as a central hub that aggregates all your workspaces and projects. It's not just a visual summary or a mere interface; it's the foundational folder-like structure where every piece of data, every project, and every workspace finds its home. A Dashboard in Retable is like a primary folder or a central directory. Within this space, you can access all your workspaces and projects, making navigation and management efficient. Instead of scouring through various sections of the platform, everything you need is conveniently located in one central place.You can perform basic operations like creating a workspace or a project on the dashboard. Additionally, you can also execute quick actions for your workspaces and projects here like renaming them or inviting your collaborators etc.
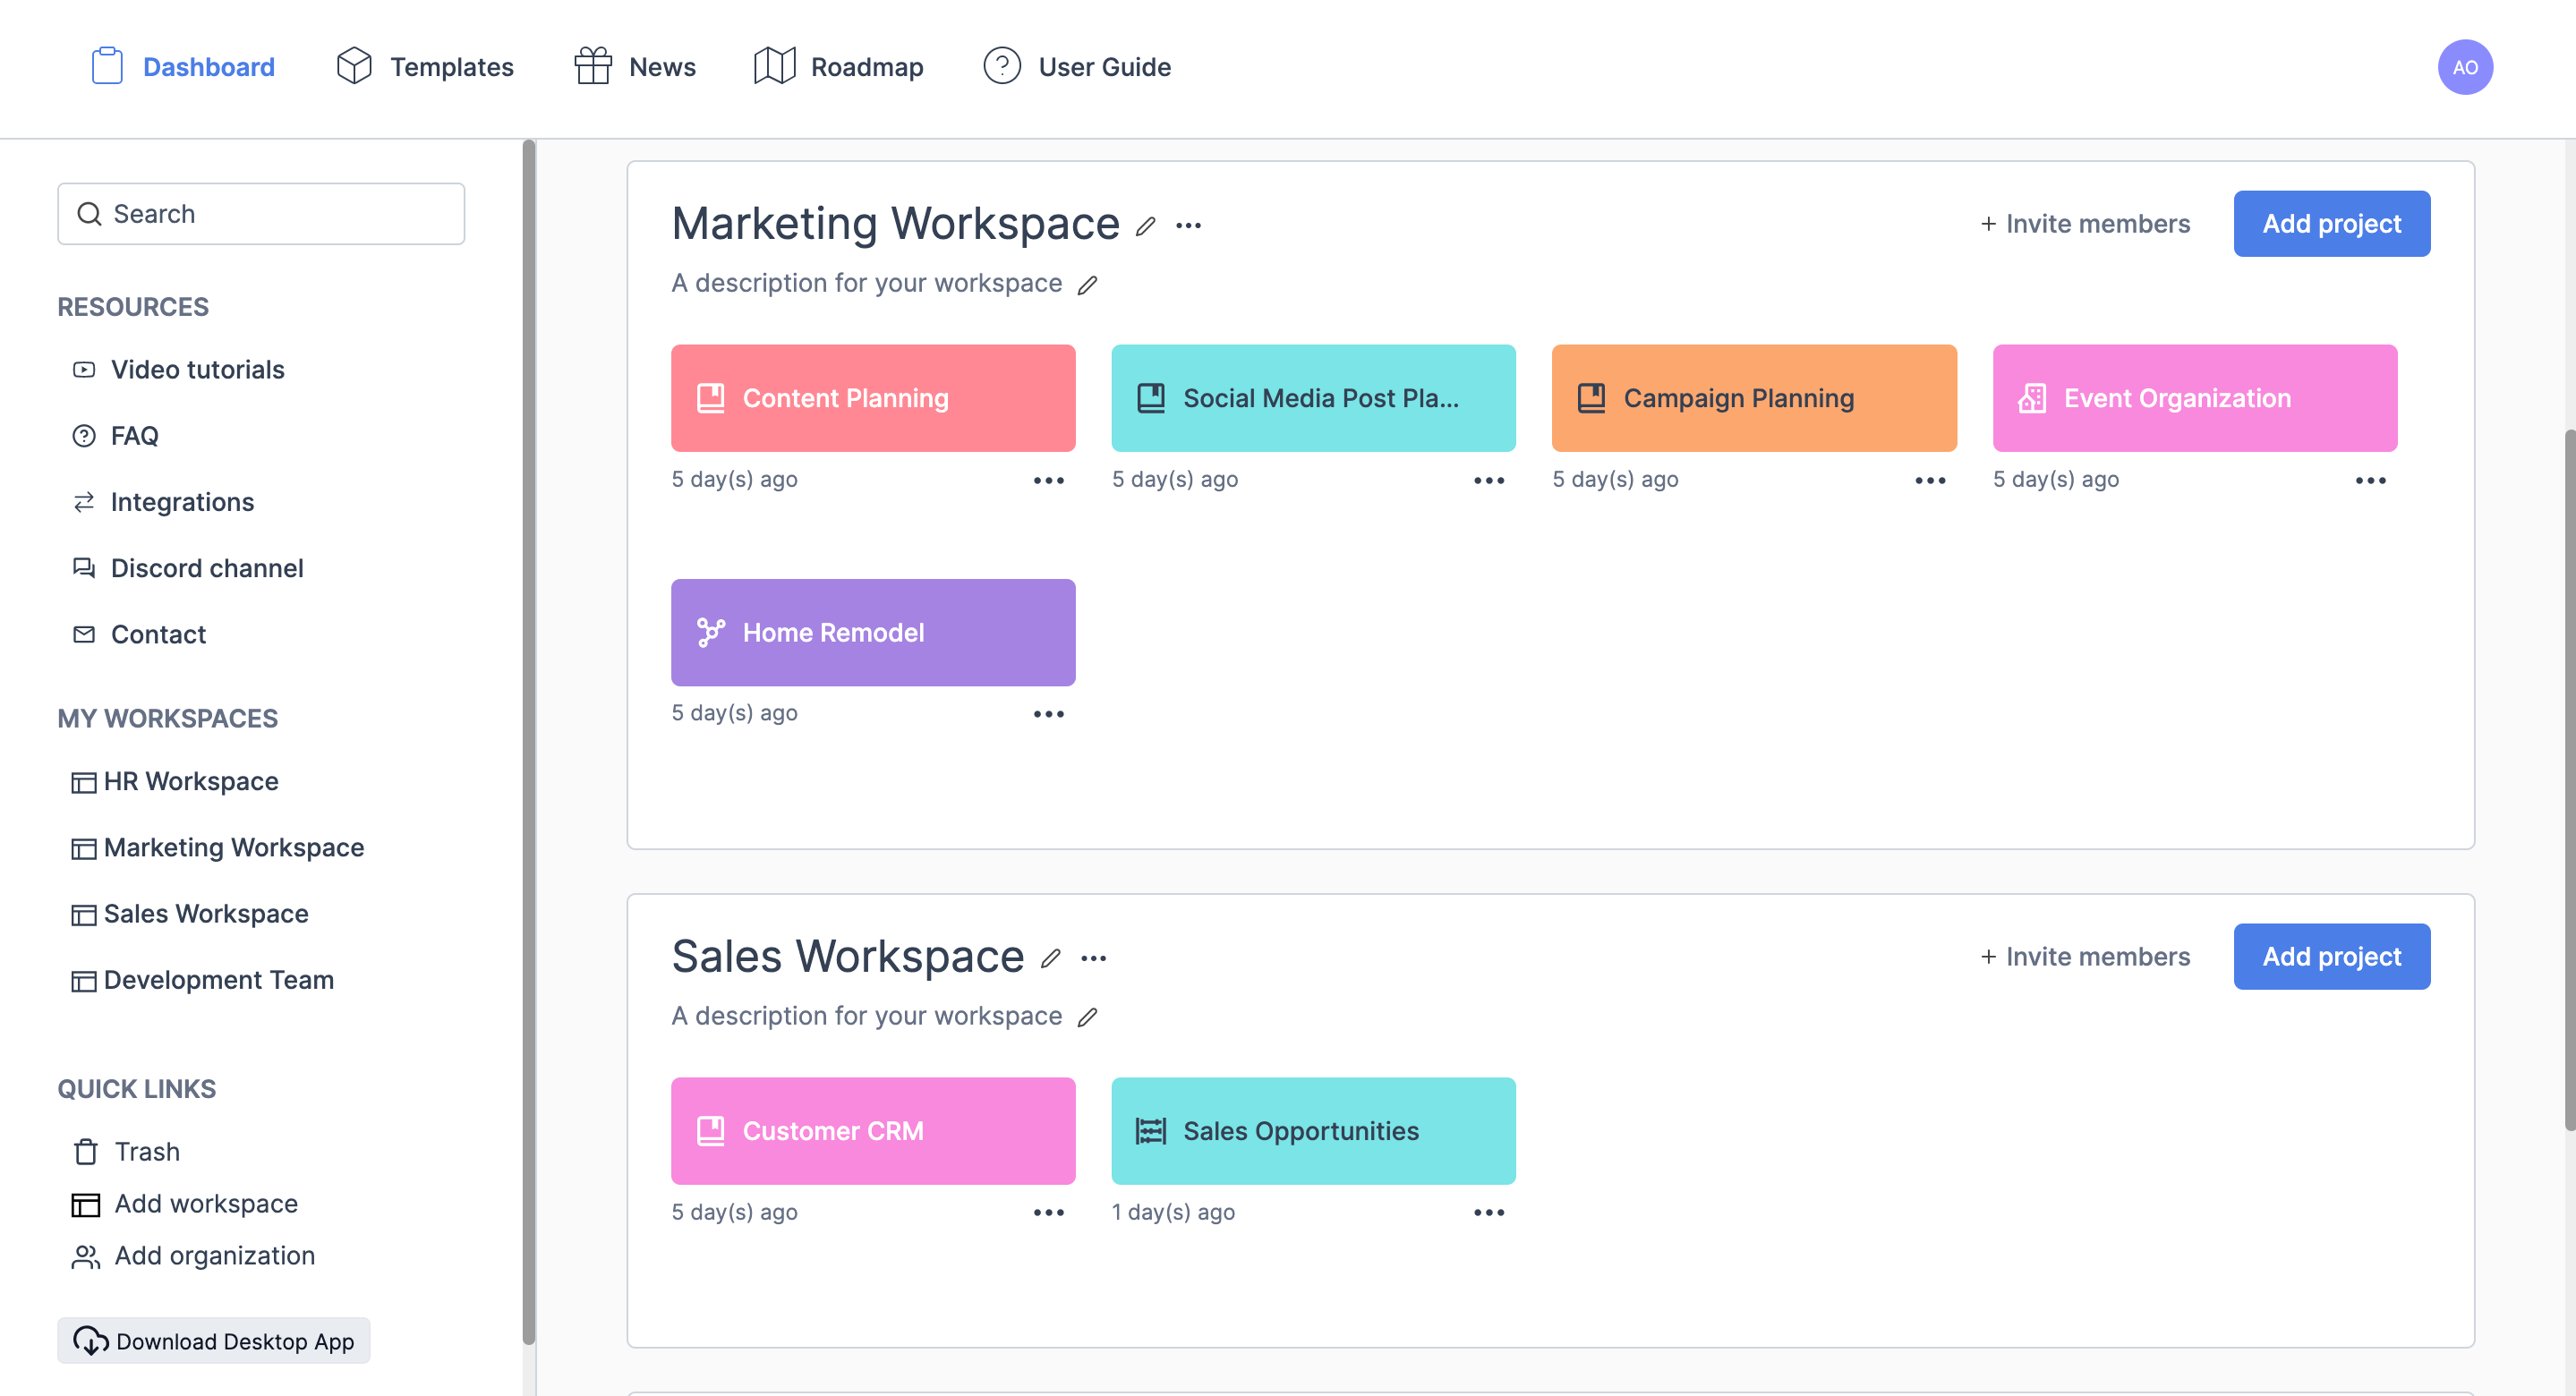
By providing a central hub for all workspaces and projects, you can navigate, collaborate, and manage your data more efficiently than ever.
Workspaces
At its simplest, a workspace in Retable is a designated area where all related content—tables, views, and projects—reside. Think of it as a digital room where you store and organize data for specific projects, teams, or topics. Each workspace is designed to contain everything you need for a particular task or theme, ensuring that information remains centralized and accessible. Workspaces are located on your dashboard and contain your projects. You can easily create new workspaces from your dashboard and group your projects under these workspaces. You can also give your colleagues workspace-based authorizations, allowing them to access all projects in your relevant workspace.
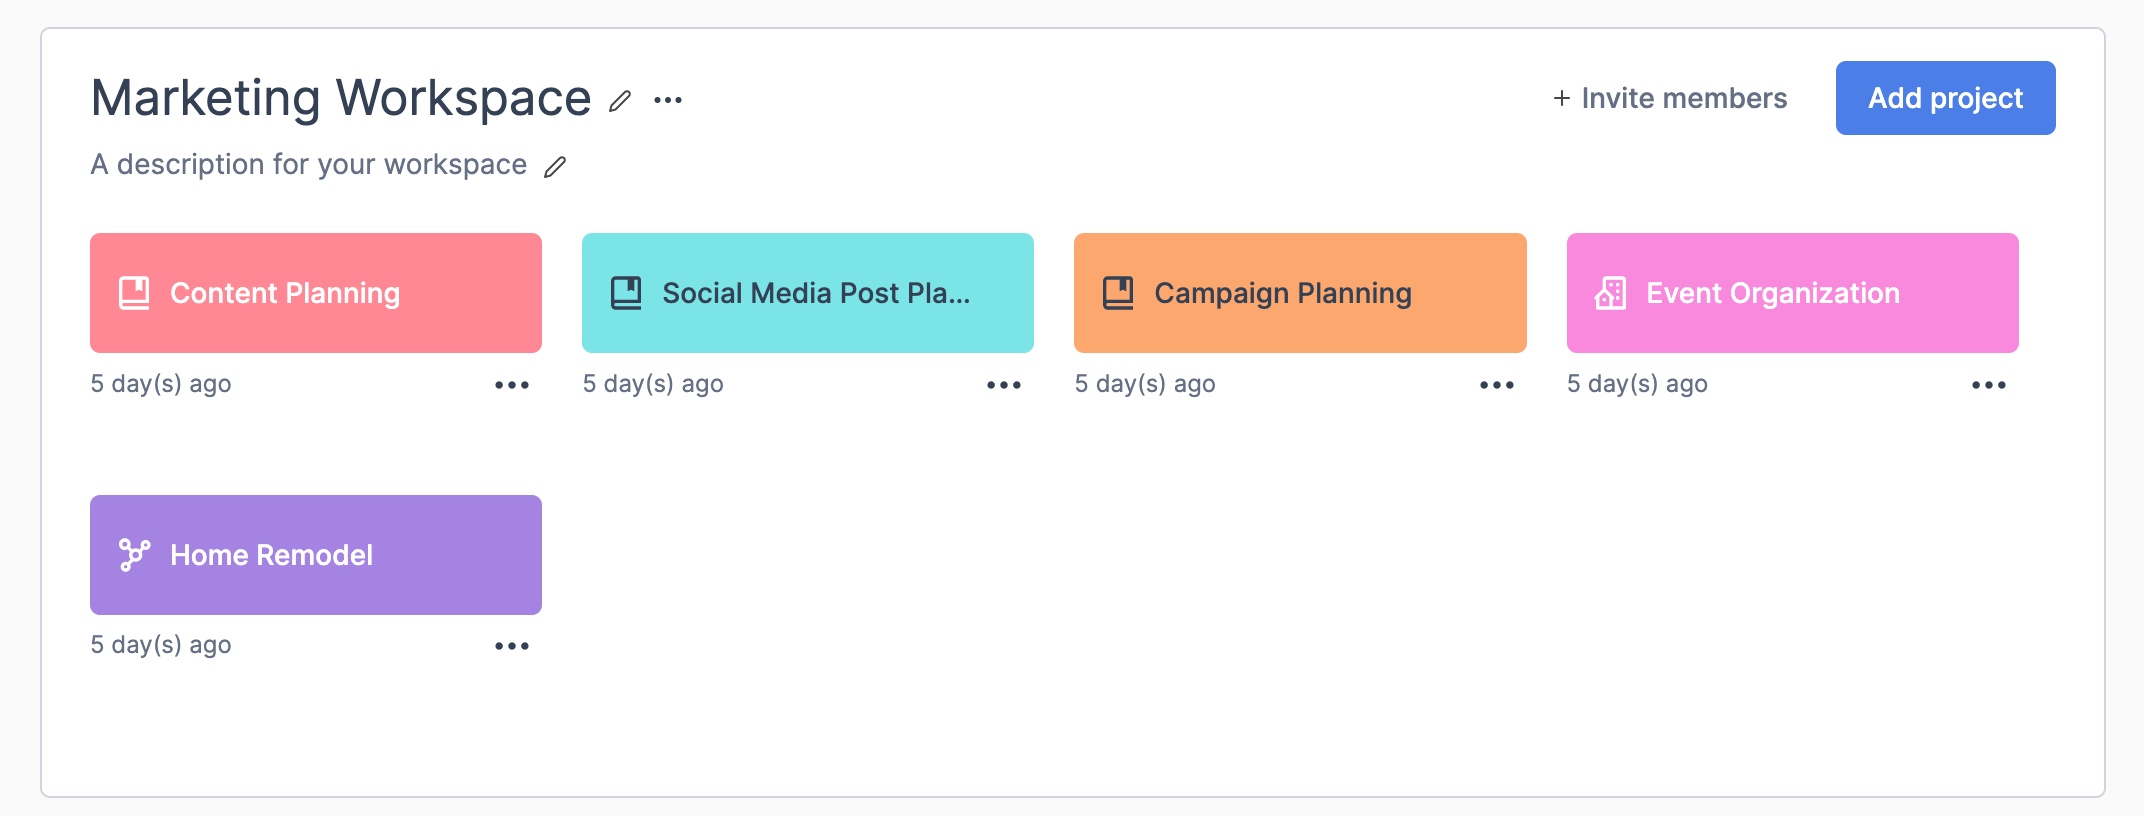
Workspaces are the foundation of your Retable experience. They provide the structure and organization needed to manage diverse data sets effectively.
Setting up your first Retable workspace
- From the Retable dashboard, click on the '+Add Workspace' button.
- Assign a name to your workspace and provide a brief description to help identify its purpose.
- Create your first project for this while creating your workspace.
- Share your workspace with your team members or anyone else you want to collaborate with. Set permissions to determine who can view, edit, or manage the workspace.
Projects
In the Retable ecosystem, a "Project" is a structured space where you can organize, manage, and collaborate on specific tasks or initiatives. Each project provides a comprehensive set of tools and views to help teams track progress, allocate resources, and manage data. Each workspace contains projects as structured data tables, with each project offering multiple tables and views.
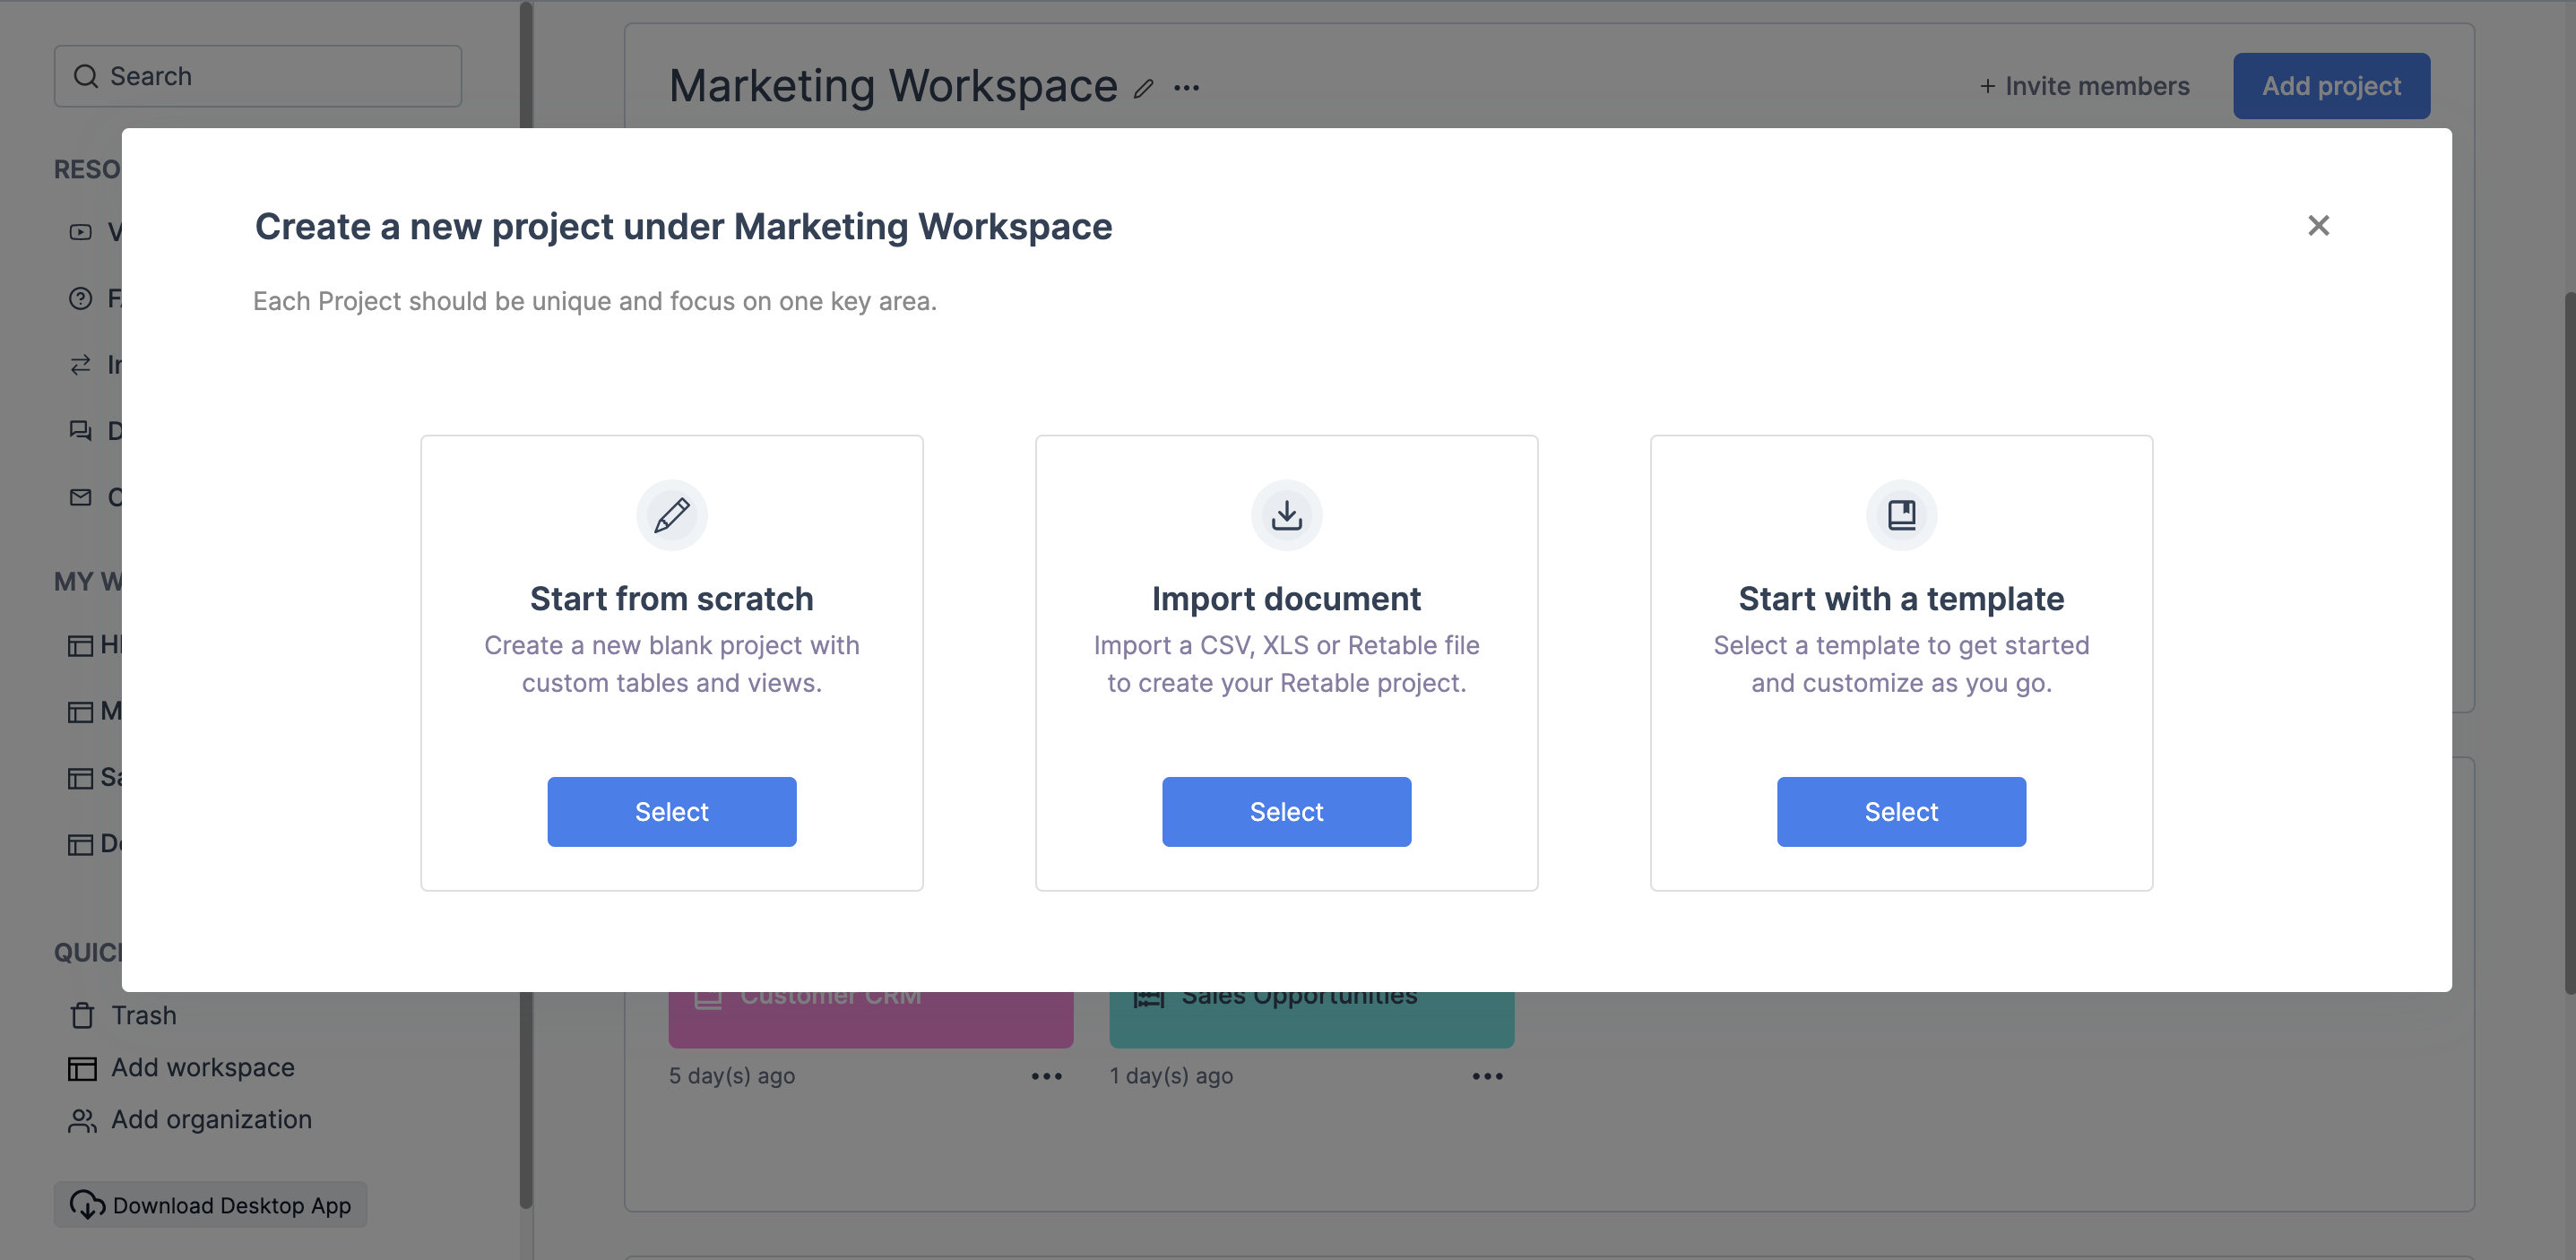
Creating a new project
- From the Dashboard, you can create a new project by selecting the 'Add Project' option directly in your workspaces.
- You can create your projects in 3 different ways.
- Start from scratch: Create a new blank project with custom tables and views.
- Import document: Import a CSV, XLS or Retable file to create your Retable project.
- Start with a template: Select a template to get started and customize it as you go. - Assign a specific name to the project and provide a brief description to guide team members.
- Share your project with your team members or anyone else you want to collaborate with. Set permissions to determine who can view, edit, or manage the project.
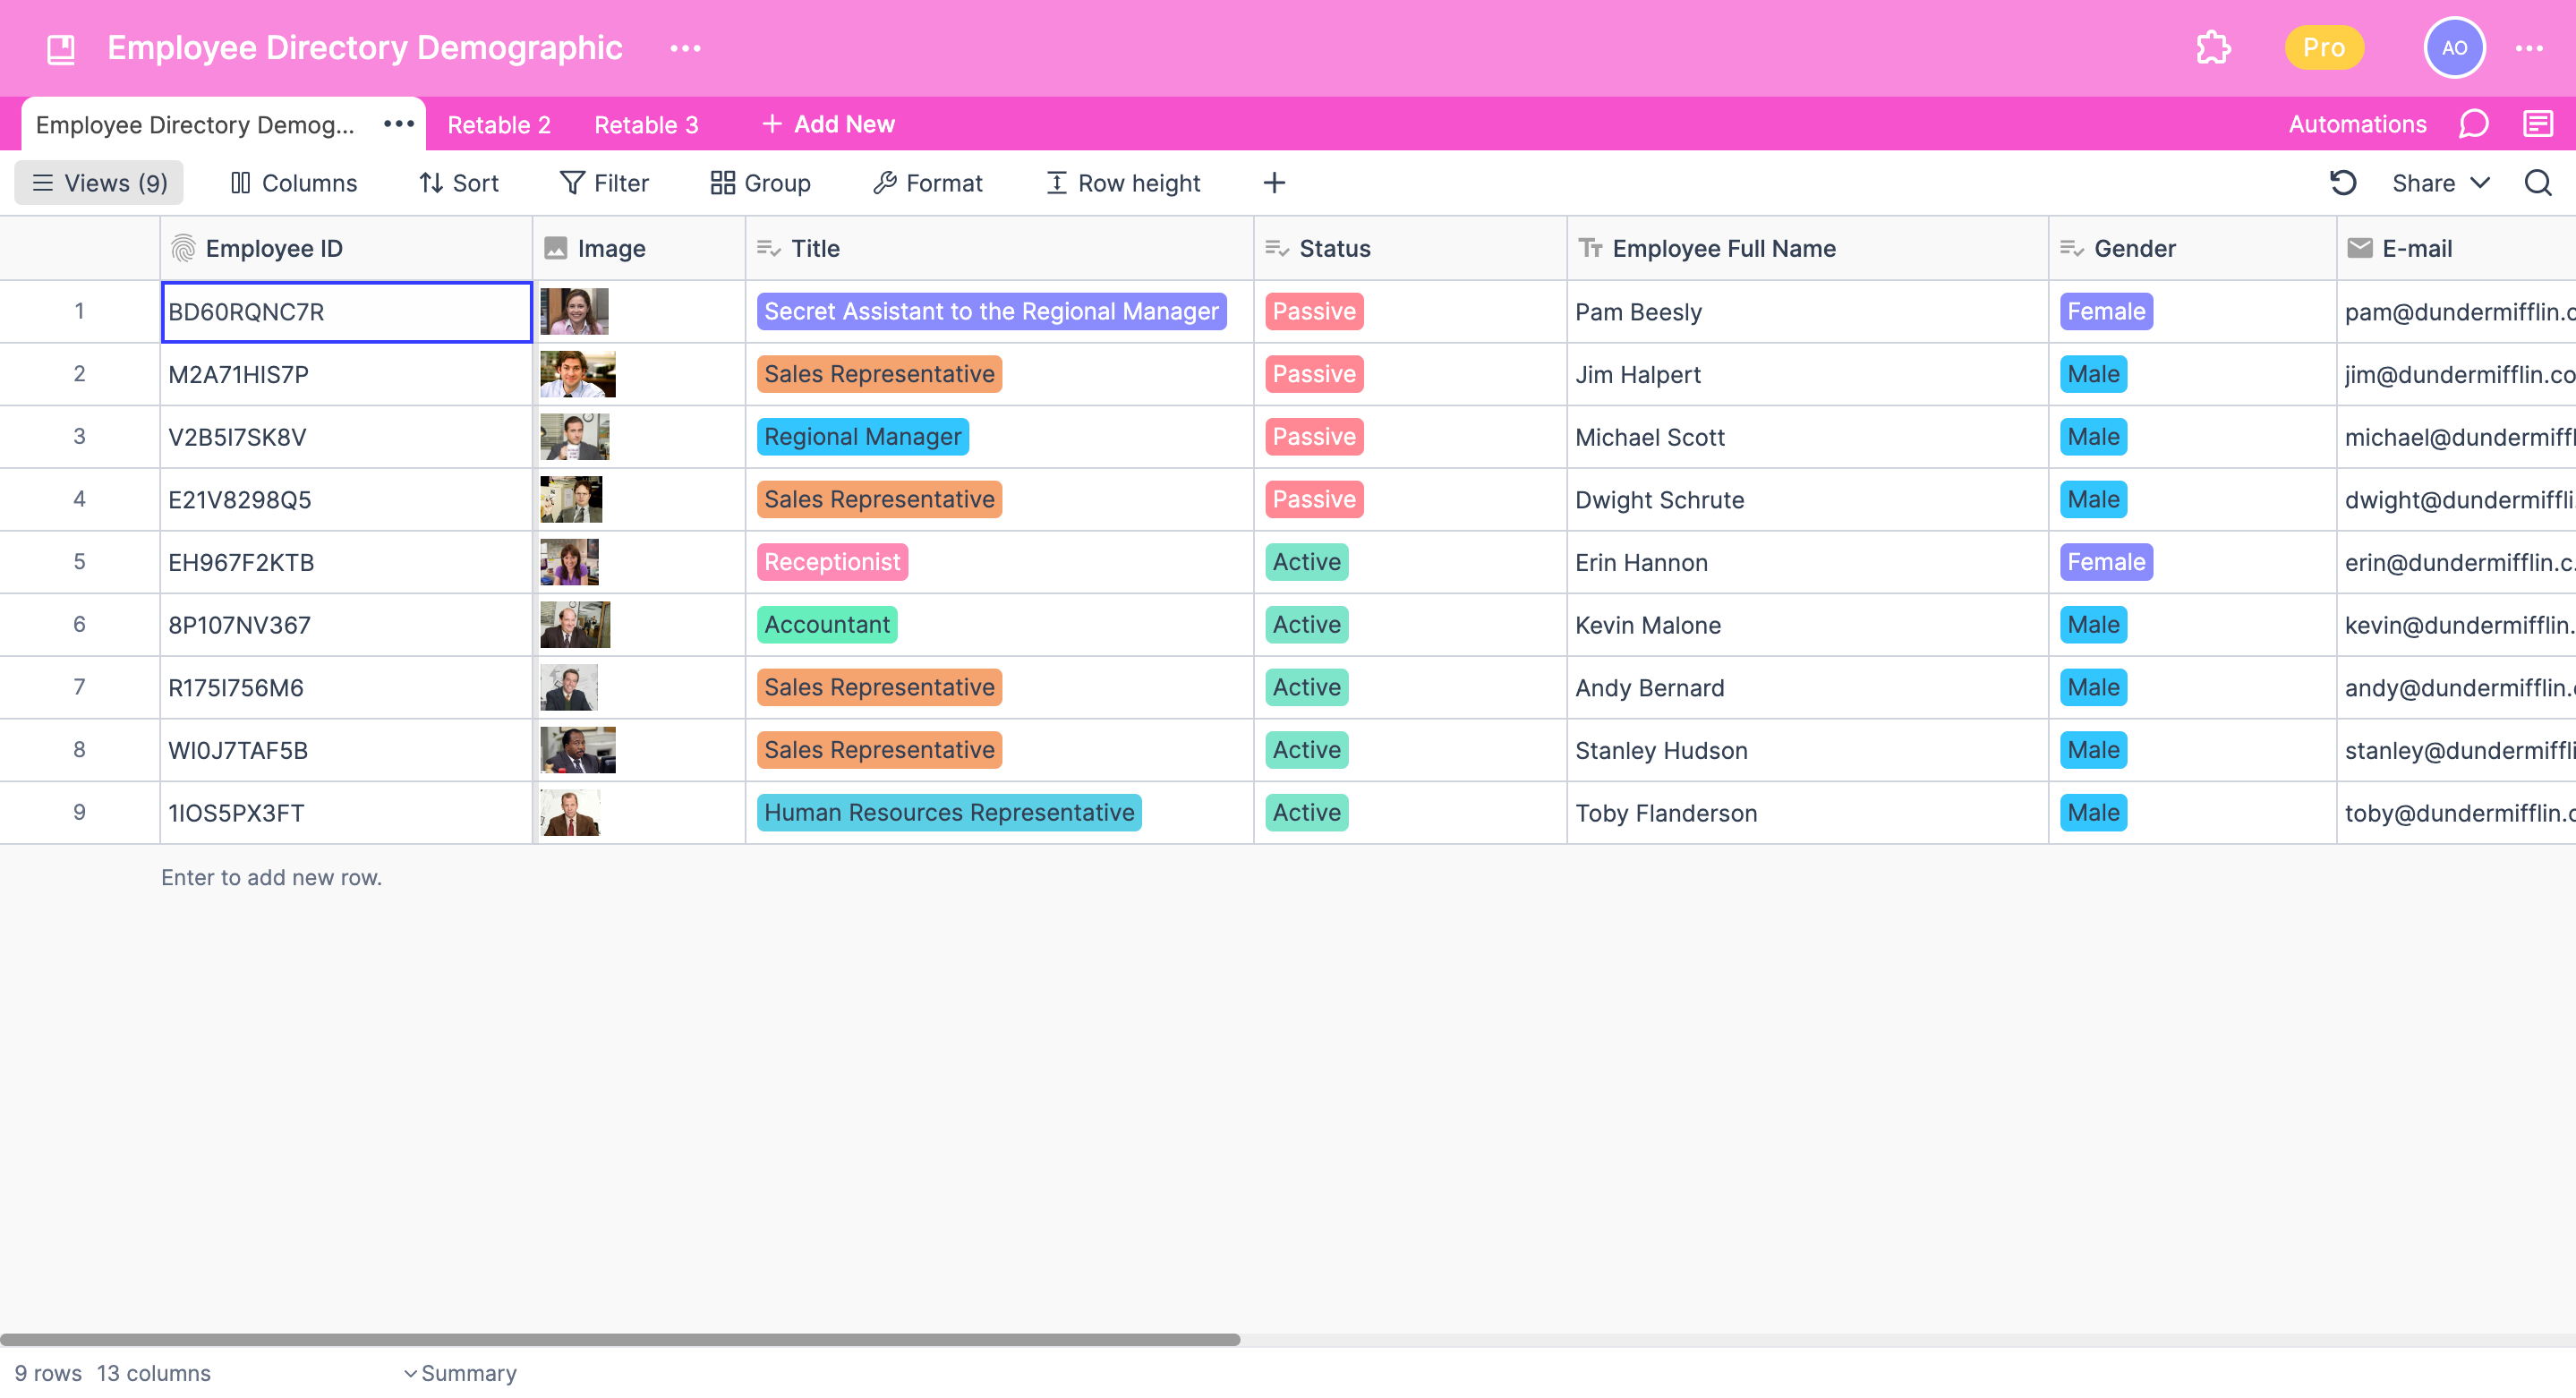
When you start a project in Retable, you'll see a table with rows and columns, known as a grid view. You can have more than one table in a project. To add tables, just use the tab panel above the project toolbar. Simply put, a project is a place where you can have many tables.
Tables
Retable tables are the primary structures where your data resides. More than just a collection of rows and columns, they serve as dynamic canvases that can be tailored to various needs, from simple lists to complex relational databases.
Creating and customizing tables
- From within a project, use the tab panel to initiate a new table. This will open up a grid view where you can start inputting data.
- Give your table a descriptive name to reflect its content or purpose. Organize columns based on the data types you want to capture, such as text, numbers, dates, or even attachments.
Retable tables are versatile tools, bridging the gap between traditional spreadsheets and modern data management solutions. By understanding how to effectively utilize tables, you can elevate your data organization, visualization, and collaboration capabilities.
Views
In the Retable, "views" are more than just ways to look at your data. Retable data views tailored lenses that help you visualize, understand, and interact with your data in different formats, each serving a distinct purpose based on the user's needs.
Exploring Different Types of Views
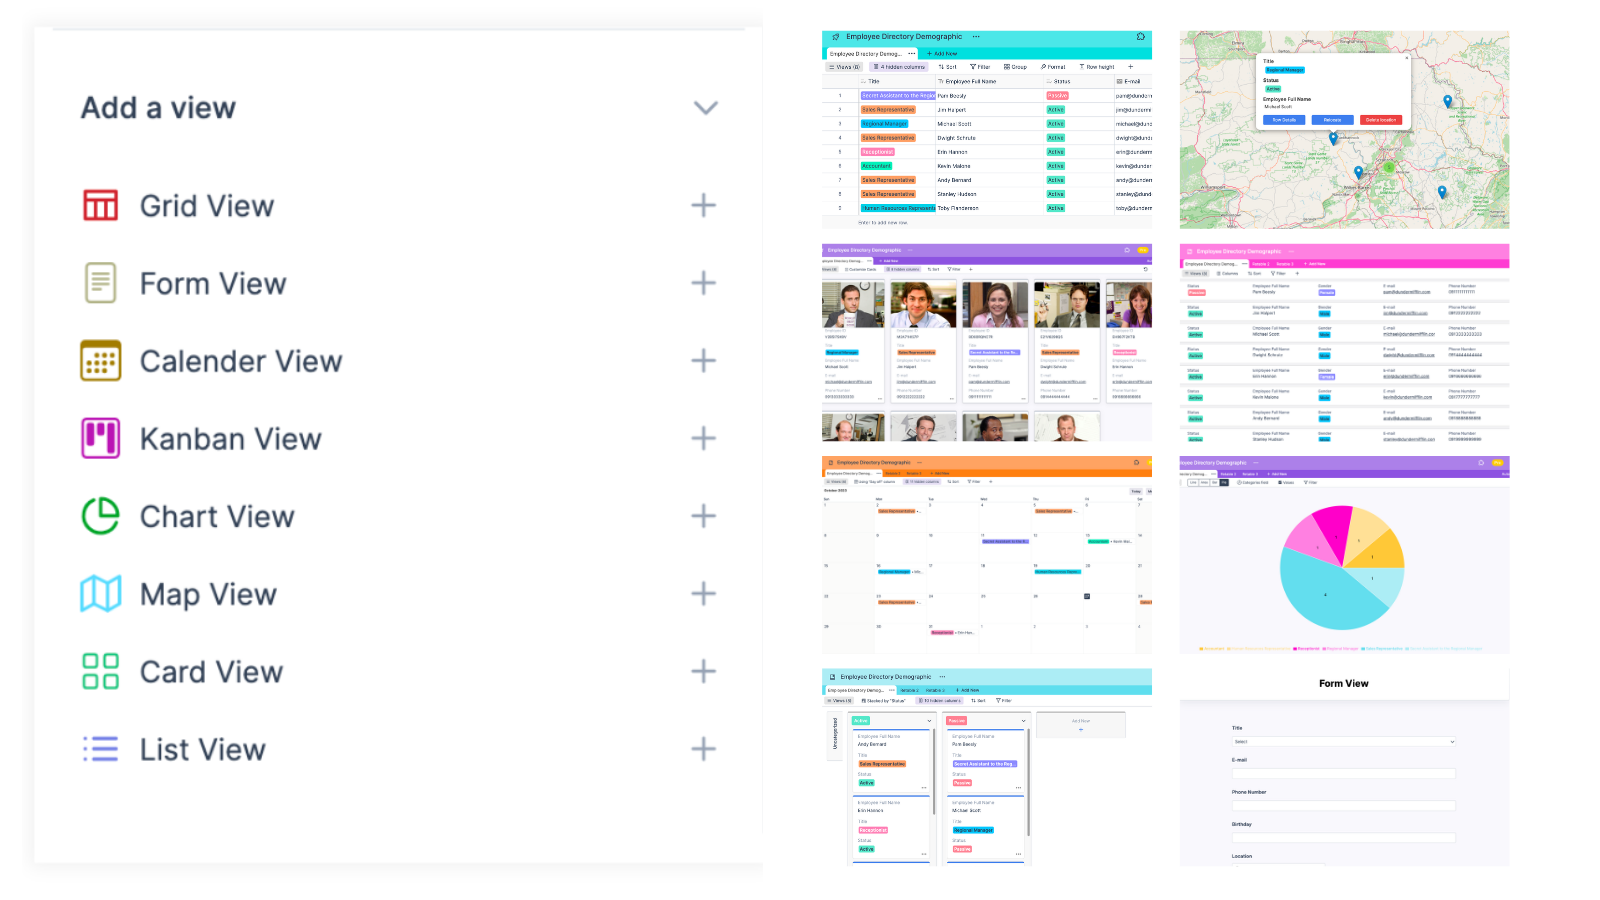
'Views' offer diverse ways to visualize your data. Whether it's the structured layout of Grid View, the timeline clarity of Calendar View, the visual emphasis of Card View, the workflow progression of Kanban View, or the interactive data collection of Form View, each provides a unique lens to understand and interact with your information, catering to varied user needs.
- Grid view: This is the default view in Retable, resembling a traditional spreadsheet with rows and columns. It's ideal for users who want a straightforward, table-like presentation of their data.
- Calendar view: For projects and tasks with date parameters, the Calendar View offers a time-based visualization. Events, milestones, and tasks can be seen in a daily, weekly, or monthly format, making it easier to track timelines and deadlines.
- Card view: When data has visual components, such as images or graphics, the Card View shines. It presents records as individual cards, showcasing the visual content prominently.
- Kanban view: Borrowed from the agile methodology, the Kanban View organizes data into columns, usually representing stages or phases of a process. It's perfect for tracking workflows, task progress, or project stages.
- Form view: When you want to collect data, the Form View turns your table into an interactive online form. Users can fill out the form, and the data directly populates the corresponding table in Retable.
- List view: Provides a simplified, linear presentation of your data, making it easy to skim through records without the layout of a grid.
- Map view: Visualize records with geographical data on a map, allowing for spatial analysis and location-based insights.
- Chart view: Turn your data into charts and graphs, providing a visual representation of statistics, trends, and patterns.
Customizing Views for Specific Needs
Retable's flexibility doesn't end with its variety of views. Each view type can be customized:
- Filtering: Display only the data that meets specific criteria.
- Sorting: Organize data based on one or more columns.
- Grouping: Cluster data based on similar attributes or categories.
- Column hiding/showing: Customize which columns or fields are visible in a particular view.
Switching Between Views
Transitioning between views in Retable is seamless. With just a few clicks on the view panel, located typically at the left of your table, you can toggle between different view types, allowing for diverse perspectives on the same data set.
Conclusion
Recap of Retable's unique structural components
Retable has undeniably redefined the way we perceive and interact with spreadsheets. Its introduction of dynamic workspaces, projects, and tables provides an unparalleled level of organization and efficiency. Yet, where Retable truly stands out is in its diverse views, from the basic grid view to the visually compelling gallery and map views. These components not only enhance user experience but also make data management more intuitive and powerful.
The future potential of Retable in the spreadsheet landscape
Looking ahead, the potential of Retable in the spreadsheet realm is immense. As the digital landscape continually evolves, so do the needs of users. Traditional spreadsheets, while foundational, have limitations that modern-day projects often surpass. Retable, with its innovative approach and flexible features, is poised to bridge this gap.
With its continued focus on user-centric design and functionalities, Retable is set to further push the boundaries of what spreadsheets can achieve. As integrations expand and AI-driven features possibly get integrated, one can anticipate a future where Retable not only streamlines data management but also offers predictive insights and automations that transform the way businesses and individuals work.
In essence, while Retable has already marked its territory in the spreadsheet landscape, its journey has just begun. The coming years promise exciting advancements, solidifying Retable's position as a game-changer in data management and visualization.
more
Related Resources


Create your smart data management solution
Plan, track, and analyse with your ease. Transform your data with an all-in-one platform, collaborate with your teammates.
Try for Free